- Home
- /
- Look How Our Map...
Look How Our Map Has Grown!
The Living New Deal is recording the public works built under the New Deal across the entire United States and its territories. The inventory is made visible through an online map and can be accessed through the map, lists of sites by state and city, and individual State Pages. Since 2012, the database and map have been expanding by leaps and bounds, doubling from 2,500 to 5,000 sites during 2013, doubling again to 10,000 in 2015 and hitting 15,000 in 2018. For the most recent figures, scroll down to the bottom of this page.
The Living New Deal website has also grown rapidly: visitor traffic hit 250,000 per year in 2013; accelerated after it was named one of the top-10 websites; reached 500,000 in 2016; passed 1,000,000 in 2018; and was well over 2 million visits by 2022. We are now the #1 clearinghouse for New Deal information online today.
A California Start-Up
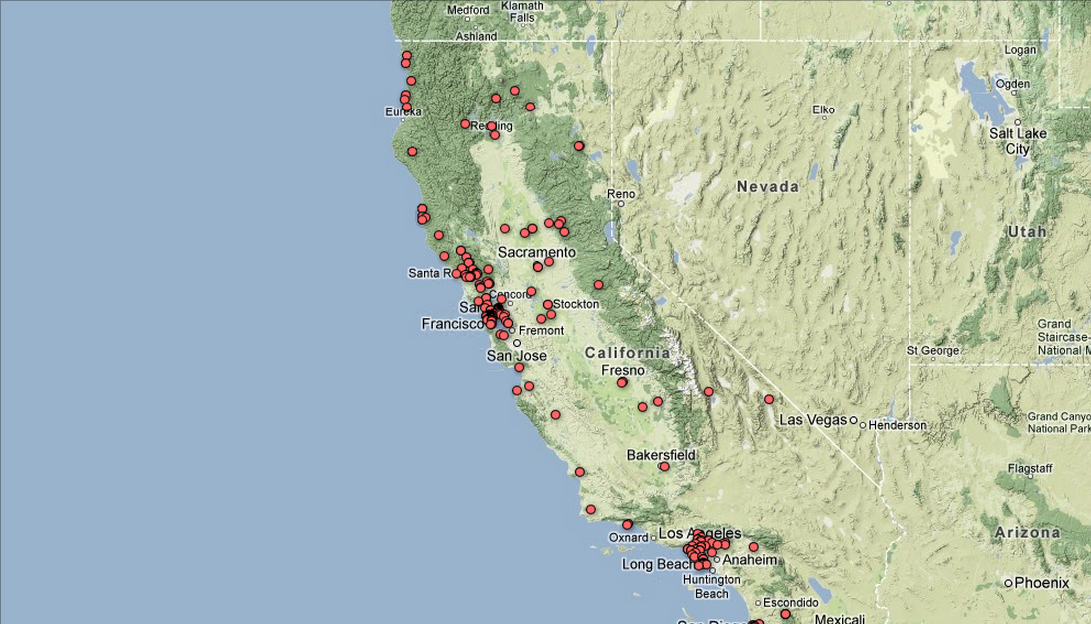
In our earliest days as a group of Berkeley volunteers, we began mapping New Deal San Francisco. Here’s how it started out way back in 2006:

Within a couple of years we had begun to be a real organization and had extended our work across the state as The California Living New Deal project, shown here c. 2008:
Mapping the New Deal Nation
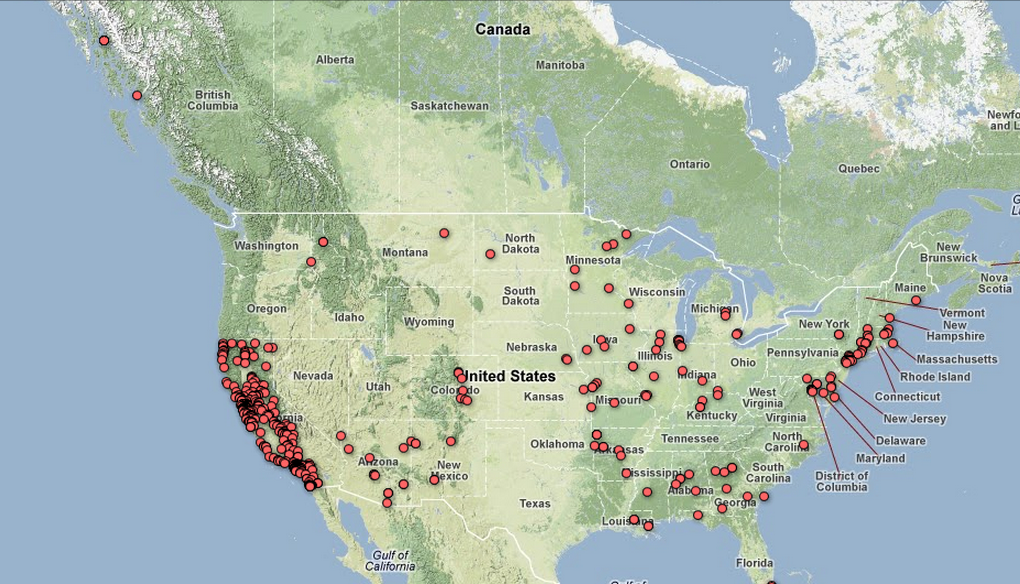
With over 1,000 sites in California, we decided to go national in 2010; this was the launch of the second-stage rocket that is the present Living New Deal. As our map began to push eastward, most of the country was still wide open spaces, as seen here in 2011.
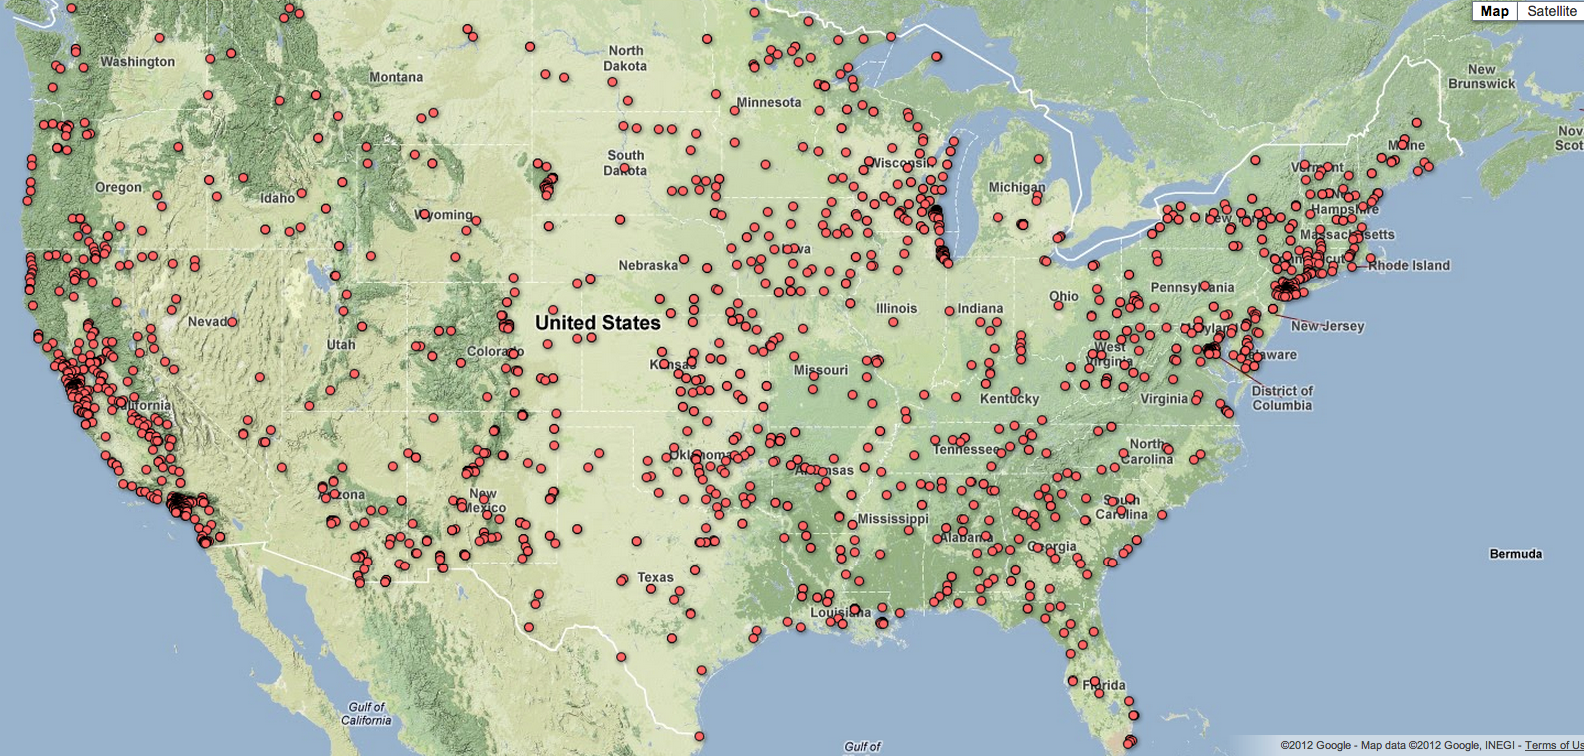
As we continued to gather data, however, the map began to look respectable, as in late 2012.
Picking Up Speed
A 2013 merger with the New Deal Art Registry meant a big leap in the data, and by the end of that year we had mapped 5,000 New Deal public works and art works. The ball was rolling now…
In August 2014, we passed 6,500 sites and the map began to look like a solid mass of dots across the country – plus many sites in Hawaii, Alaska and the Canal Zone that are not shown here:

At the end of 2014, we hit 8,000 New Deal project sites.
A Major Milestone: 10,000 sites mapped
By July 2015, we had reached the 10,000 mark, a significant step, and gone over 100 sites in 40 states.

By May 2016, we had vaulted over the 11,000 mark in sites mapped.

By January 1, 2017, our total had passed 12,000 and it was getting hard to see any open spaces east of the 100th meridian at this level of resolution, so here it is again at higher res:

All the above maps of the Lower 48 miss out on something important: all the outlying sites in Alaska, Hawaii, Puerto Rico, the Virgin Islands, Guam and the Canal Zone, which can only be seen by pulling back:

Another Notable Milestone
In mid-2018, we reached the 15,000 mark, a fifty percent gain over the previous three years. By the end of 2019, we hit 16,000 sites on the map.

Through the epidemic of 2020, progress on the map slowed down because we suffered a major hack of our host web server that deleted over 3000 photographs; those had to be tracked down and reentered – a very time consuming activity. We finally passed the 17,000 milestone in mid 2022 and have been adding steadily to the total ever since. Here is June 2022.

A key move during the pandemic was to switch from Google Maps to MapBox, an open-source mapping platform that has several advantages over Google (especially less commercial clutter). It took awhile to get all the kinks out, but we think the result looks better and is easier to use.
The new version of the national map has a very different appearance: more elegant and less cluttered; color-coded dots that turn into icons on closer zoom (indicating types of sites); and better marking of key civic facilities, parks and natural features. The filters by category and agency now work perfectly.
Advances continued 2023 in both the number of New Deal sites on the LND map, passing 18,000 in the Fall, and in the look of the background map, with better naming protocols for towns, rivers, and lakes. Here is how it looked at the end of the year:

Check out the current map here.
What’s Next?
The Living New Deal database continues to grow, as our volunteer network of over 50 National Associates send in new site data every week. If you would like to help us out, please Get Involved. To complete our work, we also need financial help from everyone who cares about preserving the New Deal legacy; you can make a donation here.