- Home
- /
- New Deal Success
New Deal Success
This section counters the common fiction that the New Deal was a failure or, at best, a well-intentioned but ineffective approach to the catastrophe of the Great Depression. In fact, the New Deal’s policies were a great success in most areas it tackled, from banking reform to reducing unemployment.
Below you can find summaries & statistics on key dimensions of economic recovery and social welfare in the 1930s, plus the role of New Deal programs in addressing each problem and the longer-term implications of the New Deal’s beneficial policies.
(Note: This is an ongoing project to which new topics will be added over time)
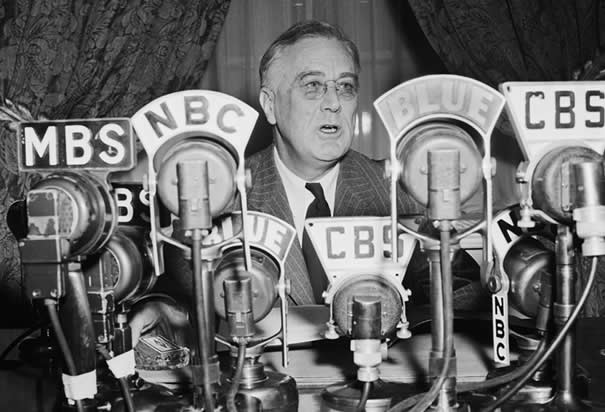
The Great Depression had brought the country to its economic knees by the time Franklin Roosevelt entered the White House in March 1933. FDR and his team launched the New Deal to help get the country back on its feet. They succeeded, yet the myth persists that the New Deal had little effect on economic recovery and only World War II ended the Depression.
The proximate cause of the Great Depression was the financial meltdown that began in October 1929. Stock prices nosedived, millions defaulted on mortgage payments, thousands of firms and banks were shuttered. The scariest moments were the Wall Street panic of late 1929 and the bank implosion of early 1933.
The real economy was going into recession well before Black Friday, but after that shock all hell broke loose. Investment shrank, wages were slashed, layoffs multiplied and consumer demand shriveled, propelling the economy into a downward spiral. By early 1933, GDP had fallen by half, industrial output by a third, and employment by one-quarter.
When President Roosevelt took office, the first order of business was to get the country’s financial house in order. The next order of priority was to provide relief and employment was the working people of the country. Along with these material strategies, FDR knew he had to provide a traumatized nation with hope that its problems could be solved and to give the American people a helping hand in getting back on their feet.
As the New Deal took hold, the economy took off, with growth reaching double-digit rates in 1934 and 1936. By 1937, the Great Recovery had pushed output, income and manufacturing back to 1929 levels. Then, recession hit in 1937-38, dropping output by a third and driving unemployment back up – in part due to FDR’s wish to return to a balanced budget and the Fed’s desire to tighten up on the money supply (both were mistakes). After growth resumed in 1939, however, the economy made it all the way back to its long-term trajectory by 1942 (i.e., as if the Depression had not happened). In short, national output and income had fully recovered before the United States entered the Second World War.
One glaring exception to the Great Recovery was unemployment, which stayed near 10% – a fact that has been used to forever mar the New Deal’s reputation. The failure of a booming economy to absorb surplus labor was due chiefly to the way business had shuttered factories, warehouses and railroads during the Depression then replaced them with more productive capacity and equipment during the recovery. Ironically, the New Deal contributed to higher productivity by such means as better roads, hydroelectric dams, rural electrification and better health of workers.
World War II brought full employment through military recruitment and full-tilt production for the war effort. The federal government was even moreactive in stimulating the economy than during the New Deal, financing thousands of new factories and running more massive deficits than the New Deal ever dared. Contrary to common perception, however, overall productivity did not increase much during the war.
To be sure, economic growth, industrial productivity and high US wage rates cannot simply be ascribed to the New Deal or government policy alone. By the 1920s, the American economy was the largest in the world and the assembly line, electricity, chemicals and petroleum had unleashed a new industrial revolution, of which the United States was the clear leader. But the New Deal played a key role in halting the downward spiral of the Great Depression and boosting the wages and welfare of millions of ordinary Americans.
Conservatives have long denied the New Deal’s effective response to the Great Depression, as when Republican Senate leader Mitch McConnell declared: “We know for sure that the big spending programs of the New Deal did not work.” (“Revisionists’ blind view of the New Deal,” Politico, February 13, 2009). Today, many skeptics similarly view the Green New Deal initiative as hopelessly pie-in-the-sky. Nonetheless, the experience of the New Deal proves that big government programs can reap big rewards, if done right.
Economy & Business
If the fall into the Great Depression was precipitous, the rise from the depths of the crisis was equally striking. The period from 1934 to 1942 was one of the greatest periods of economic growth in American history – a fact that has perturbed New Deal critics from the 1930s to the present. The average rate of growth in Gross Domestic Product (GDP) was around 10% for the decade, comparable to the phenomenal growth of China in the 2000s.
The contrast with the slow recovery from the Great Recession of 2008-10 is startling. As former chair of the Council of Economic Advisors, Professor Christina Romer, has noted, “From 1933 to 1937, real gross domestic product grew at an annual rate of almost 10 percent, and unemployment fell from 25 percent to 14. To put that in perspective, G.D.P. growth has averaged just 2.5 percent in the current recovery, and unemployment has barely budged.”
Here are the annual figures for U.S. GDP – the total value of all goods and services produced – from 1929 to 1941, in billions of dollars:
1929: 104.6
1930: 92.2
1931: 77.4
1932: 59.5
1933: 57.2
1934: 66.8
1935: 74.2
1936: 84.8
1937: 93.0
1938: 87.4
1939: 93.4
1940: 102.9
1941: 129.3
Here are the figures for the annual rate of growth in GDP adjusted for inflation — from 1930 to 1941 in percent:
1930: -8.5
1931: -6.4
1932: -12.9
1933: -1.2
1934: +10.8
1935: +8.9
1936: +12.9
1937: +5.1
1938: -3.3
1939: +8.0
1940: +8.8
1941: +17.7
The foundation for this rapid growth was the new industrial revolution of the early 20th century, based on the assembly line, electricity, chemicals and petroleum. United States was the world’s largest and most dynamic economic power by the 1920s. Nevertheless, the collapse of 1929 to 1933 had to be stopped before the economy could renew its upward climb, and the New Deal played a major role in halting the bleeding and kick-starting the recovery.
First, the Roosevelt administration put the banking and financial system back on a solid footing: failing banks were culled, deposit insurance instituted, homeowners bailed out, and mortgages guaranteed. The dollar was untied from the Gold Standard and devalued. The Federal Reserve Bank loosened up money supply. Credit began to flow again.
Second, the federal government pumped billions of dollars into the economy through emergency relief funds and public works programs, while running the first peacetime deficits in US history. Not only were millions of desperate Americans put back to work, but their wages gave families spending money to boost aggregate consumption.
The New Deal’s aggressive monetary and fiscal policies had a stabilizing and stimulating effect on the American economy, and they were put in place even before the terms were invented and theorized by the economist John Maynard Keynes in 1936.
It should be added that the New Deal influenced America’s Golden Era of postwar economic growth. It laid the building blocks for the expansion of the middle-class, such as protections for unions, the 30-year mortgage, and more education & training. New Deal public works remained in use for decades after the 1930s, including highways, dams, electric lines, and sewer systems.
Between 1946 and 1980 (35 years) annual economic growth exceeded 5 percent 12 times. By contrast, from 1981 through 2018 (38 years), annual economic growth exceeded 5 percent just once (1984). The latter was the so-called Neoliberal era of tax-cutting, deregulation, union decline, stagnant wages, and rising inequality – very much the opposite of the New Deal era.
Note: GDP statistics are from the U.S. Bureau of Economic Analysis. The quote from Christina Romer comes from her op-ed, “The Hope That Flows From History,” New York Times, August 13, 2011.
After a shocking drop-off of 1931-1933, US corporate profits began to recover during the New Deal. This was true even with corporate tax increases and greater efforts to stop corporate tax avoidance (see our Income and Wealth Taxes program summary ).
The war years were even better for corporations, thanks to full capacity use of factories, wage restraints and price controls – again led by the federal government.
Here are the after-tax profits in billions of dollars for America’s corporations, 1929-1946:
1929: 9.5 billion
1930: 3.7 billion
1931: .06 billion
1932: 1.7 billion
1933: 1.3 billion
1934: 2.5 billion
1935: 3.4 billion
1936: 5.7 billion
1937: 6.1 billion
1938: 3.6 billion
1939: 6.3 billion
1940: 7.8 billion
1941: 11.2 billion
1942: 11.1 billion
1943: 11.8 billion
1944: 11.8 billion
1945: 9.7 billion
1946: 16.5 billion
Note: Data is from the U.S. Bureau of Economic Analysis, “Table 6.19A. Corporate Profits After Tax by Industry,” accessed May 18, 2019.
Bank failures were a prominent feature of major economic downturns in the 19th and early 20th centuries. Many Americans lost their savings when banks failed, further driving down economic activity. There were many state-level experiments to insure bank deposits, but none proved to be viable in the long-term.
The thousands of bank failures of the Great Depression, 1929-1933, were the worst case of financial implosion the country had ever seen, and the states alone were unable to stop the collapse. While the Federal Reserve bank system had been created in the wake of the financial crisis of 1908, the Fed remained a conservative bankers’ institution and did not react in a way that helped cushion the banks from deflation; in fact, the Fed made everything worse by tightening up the money supply!
Here are the figures on the number of bank failures around the country from 1921 to 1933, showing the growing bank crisis following on the Stock Market Crash of 1929:
1921: 506
1922: 366
1923: 646
1924: 775
1925: 617
1926: 975
1927: 669
1928: 498
1929: 659
1930: 1,350
1931: 2,293
1932: 1,453
1933: 4,000
On June 16, 1933, a surprisingly hesitant President Roosevelt agreed to sign legislation that included the creation of the Federal Deposit Insurance Corporation (FDIC). By insuring bank deposits up to a certain amount, FDIC gave Americans a greater sense of security that if their bank failed they would not be left destitute. This sense of security reduced “bank-runs” (a mass, panicked rush to remove money from a distressed bank), which in turn helped banks avoid failure.
Here, by contrast, are the numbers of bank failures, 1934-1946, after the New Deal’s creation of the FDIC (on a base of 13,000-14,000 FDIC-insured banks):
1934: 9
1935: 25
1936: 69
1937: 75
1938: 74
1939: 60
1940: 43
1941: 15
1942: 20
1943: 5
1944: 2
1945: 1
1946: 1
As the chart highlights, the FDIC (alongside other New Deal banking actions) was astonishingly effective, virtually eliminating bank failures altogether.
In fact, from 1934 to 1981 the number of bank failures never exceeded 100 annually, even as the total number of banks remained relatively unchanged. Unfortunately, since deregulation fervor began around 1980, bank failures have exceeded 100 a number of times, with a high of 534 in 1989. Moreover, the savings & loan sector – which had also been shored up during the New Deal – imploded in the financial crisis of 1986-87 and effectively disappeared thereafter.
Note: Most of the information and statistics above are from the history and data tool sections of the Federal Deposit Insurance Corporation website. Also see, “Explaining the Decline in the Number of Banks since the Great Recession,” Federal Reserve Bank of Richmond, March 2015 (accessed May 11, 2019).
Productivity rose rapidly in the economic recovery of the 1930s. In fact, the rate of increase in total factor productivity was the highest per decade going back to the 19th century and higher than any decade since. What took place was effectively a broadening of the base of the industrial and consumer revolutions of the first half of the 20th century (Field, p. 35). As Alexander Field puts it, “It was not principally the Second World War that laid the foundation for postwar prosperity. It was technological progress across a broad frontier of the American economy in the 1930s.” (Field, p. 19)
Here are the figures on annual rates of growth in total factor productivity, 1900-2007, by economic cycle (Field, p 43):
1901-1919 1.08
1919-1929 2.02
1929-1941 2.31
1941-1948 1.29
1948-1973 1.88
1973-1989 .36
1989-2000 .79
2000-2007 1.38
This key fact of the New Deal era recovery has been underestimated in the past by economic historians using inappropriate measures. One mistake has been not to use the correct peak-to-peak business cycle endpoints (in this case, 1929-1941). A second has been to look only at labor productivity – by which the 1930s comes in fifth place since 1800 – rather than total factor productivity (which includes capital inputs as well as labor); the latter better captures key changes in chemistry, materials, energy and automation. A third error has been to look only at manufacturing – which grew by a over 5% per year in the 1920s – when the biggest improvements of the 1930s came in transportation, communication, distribution and utilities (though 1930s still come in second) (Field, pp. 48-49).
The New Deal contributed to the economy’s rise in productivity in ways that went beyond the stabilization and stimulus policies discussed previously. Most of all, it underwrote collective productivity through investments in better infrastructure (Field, p. 106). The single largest public works program of the New Deal was building roads to aid the shift from railroad to truck transport – with transportation experiencing the greatest leap in productivity of all sectors (Field, p. 59). Hydroelectric dams and new power lines allowed for greater electrification of industry and households – necessary to the adoption of new machinery, including household appliances.
Meanwhile, the New Deal promoted more research and education. Its farm, forest and soil programs increased funding for research and practical assistance to the agriculture and timber sectors so that new and better production practices could be adopted. New Deal education programs – from humble CCC literacy classes to teacher aides to university buildings – improved the ability of millions of Americans to work with the new technologies being employed by US industry.
Note: Alexander Field, A Great Leap Forward: 1930s Depression and U.S. Economic Growth. New Haven CT: Yale University Press, 2011.
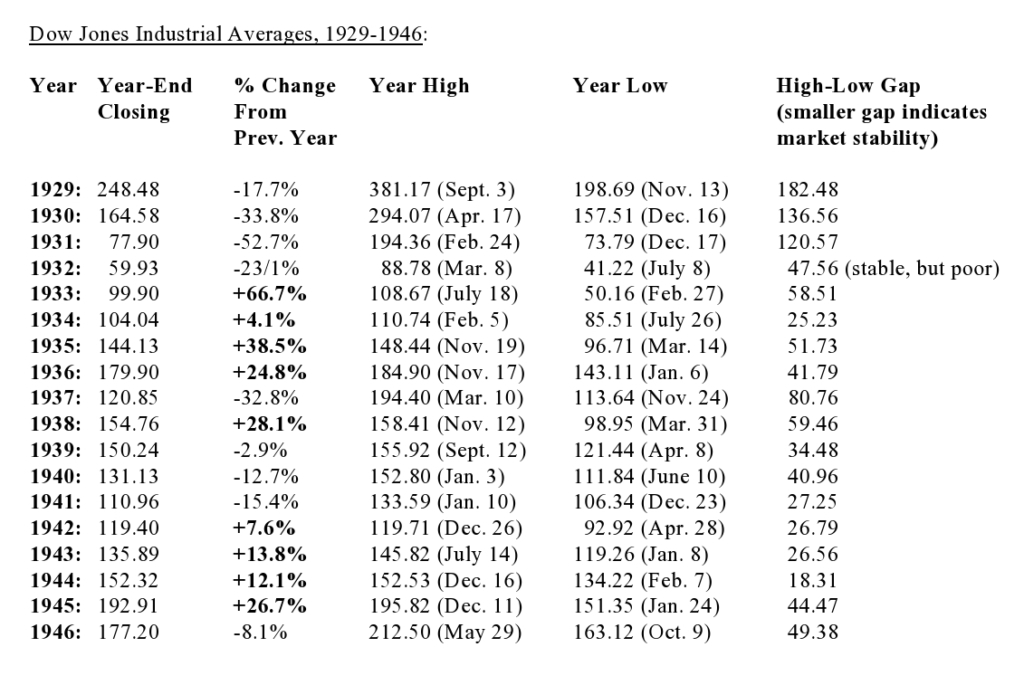
The Great Depression devastated the stock markets of New York, Philadelphia, Chicago, and San Francisco. Everyone remembers Black Monday and Tuesday, October 28-29, 1929, when the New York stock exchange index fell 25%, but the collapse continued over the next three years (with the usual ups and downs of daily trading). By the end of 1932, the Dow Jones Index of the NYSE was down by almost 90%. It would take decades for the markets to fully recover.
Part of the problem was that stock prices had been elevated in the 1920s by massive speculation, especially borrowing on margins to profit off of rising prices (Galbraith 1972). Stock manipulation (now called ‘insider trading’) added to the bloat. As historian Cameron Addis argues, “In 1929, stock share prices were running higher than their historical average in relation to how much companies were actually earning (Price/Earnings, or P/E ratios). Corruption increased the market’s instability. Small groups of wealthy men ‘painted the tape,’ driving up prices artificially by buying themselves, only to sell at high profits after other ‘suckers’ bought into the rally.”
New Deal policies introduced at the beginning of President Franklin Roosevelt’s administration in Spring 1933 worked to stabilize the stock market, along with the banks and the dollar. In particular, the Securities & Exchange Commission clamped down on the stock market fraud that had been practiced during the Roaring Twenties.
From the nadir of 1932, the Dow Jones NYSE index rose briskly, 1933-36 (see table). The short recession of 1937 knocked the market back, but it recovered in 1939 before war fears put the damper on things until the United States finally entered the Second World War in 1942. The stock market did not reach its pre-Depression highs again until the 1950s, despite the booming postwar economy. Finance had been brought back to earth – for a time.
New Deal financial regulations put the lid on speculation throughout the postwar era. Only with the growth of the Eurodollar market in London in the late 1960s did the financial markets start to escape the New Deal order. Banks and capital markets were steadily deregulated from the early 1970s onward, and the stock markets took off again, driven by options, secondary mortgages, and ever more exotic instruments and off-balance sheet banking. As the regulatory system was gutted, financial markets once again blew up with speculation in the 1990s and 2000s and the Great Recession followed the financial crisis of 2008 (Stiglitz 2010, Roubini & Mimn 2010).
Note: Statistics for the Dow Jones Industrial Average obtained, or derived from: Phyllis S. Pierce (ed.), The Dow Jones Averages, 1885-1990, Homewood, IL: Business One Irwin (for Dow Jones & Company, Inc.), 1991.
Sources noted above: Galbraith, John Kenneth. The Great Crash, 1929. Boston: Houghton Mifflin, 1972. Cameron Addis. nd. Stock Market Crash & Great Depression. History Hub at: https://sites.austincc.edu/caddis/stock-market-crash-great-depression/. Anon, “Here Are Warning Signs Investors Missed Before the 1929 Crash,” History.com, December 20, 2018. Stiglitz, Joseph. Freefall: America, Free Markets, and the Sinking of the World Economy. New York: Norton, 2010. Roubini, Nouriel and Stephen Mihm. Crisis Economics: A Crash Course in the Future of Finance. New York: Penguin Press, 2010.
Employment & Income
The massive job losses of the Great Depression’s opening years left nearly 13 million American workers unemployed in 1932-33 out of a workforce of around 50 million, or almost one-quarter of the labor force. Employment rose along with national output from 1933 onward, except for the sharp recession of 1937-38 (see entry on growth, above). By 1940 the number employed equaled the level of 1929.
The New Deal created over 20 million work relief jobs from 1933 to 1942 through programs like the Civilian Conservation Corps, Civil Works Administration and Works Progress Administration. These reduced the jobless rate by about 5%. New Deal investment programs like the Public Works Administration created about as many jobs, both directly and indirectly, in the private sector, lowering unemployment another 5% or so.
Here are U.S. unemployment rates from 1929-1940:
1929: 3.2%
1930: 8.7%
1931: 15.3%
1932: 22.9%
1933: 20.6%
1934: 16.0%
1935: 14.2%
1936: 9.9%
1937: 9.1%
1938: 12.5%
1939: 11.3%
1940: 9.5%
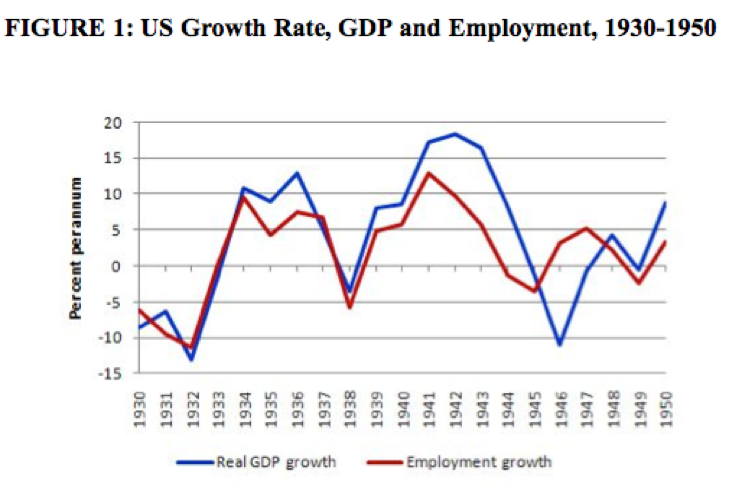
Nevertheless, the New Deal was unable to get unemployment rates down to pre-Depression levels. This was largely due to technological displacement of industrial and transport workers. The graph below shows how employment growth, while high, lagged output growth through most of the 1930s (and 1940s).
There is a good deal confusion about unemployment figures during the New Deal years. It is frequently claimed that the rate remained in the double-digits throughout the 1930s and that by the end of the decade it was still around 15%. Such claims rely on older statistics by Stanley Lebergott that counted workers in the work-relief programs as “unemployed”; subsequently, economic historians have revised the data to show the substantial difference this makes.
As historian Eric Rauchway has noted, “whether you look at the performance of GDP or at current scholarship on unemployment, you see significant recovery during the New Deal. You could only believe the New Deal did little to aid the ordinary American if you went out of your way to cite the older, Lebergott data on unemployment and utterly ignored the performance of GDP.”
It took another massive round of government spending and military enlistment during World War II to finally eliminate unemployment.
Note: On relief and public works employment, see Jason Scott Smith, Building New Deal Liberalism: The Political Economy of Public Works, 1933-1956. New York: Cambridge University Press, 2006, pp. 96-97. Unemployment statistics from Robert A. Margo, “Employment and Unemployment in the 1930s,” Journal of Economic Perspectives, Vol. 7, No. 2 (Spring 1993), pp. 41-59. Also see Michael R. Darby, “Three-And-A-Half Million U.S. Employees Have Been Mislaid; Or, An Explanation Of Unemployment, 1934-1941,” Journal of Political Economy, February 1976, 84, 1-16; and Eric Rauchway, “New Deal Denialism,” Dissent, Winter 2010, pp. 68-72. On technological displacement and investment, see Corrington Gill, Wasted Manpower: The Challenge of Unemployment, New York: W.W. Norton & Company, Inc., 1939, pp. 66-104) and Alexander Field, A Great Leap Forward: 1930s Depression and U.S. Economic Growth. New Haven CT: Yale University Press, 2011.
The Great Depression drove down wages relentlessly. Given the horrible economic conditions, businesses either laid off workers or demanded that the ones who remained accept lower wages (and fewer hours) to keep their jobs. Mass unemployment put a fierce downward pressure on wages through 1933, which hit their nadir in 1933; this was especially true for industrial workers and the less skilled.
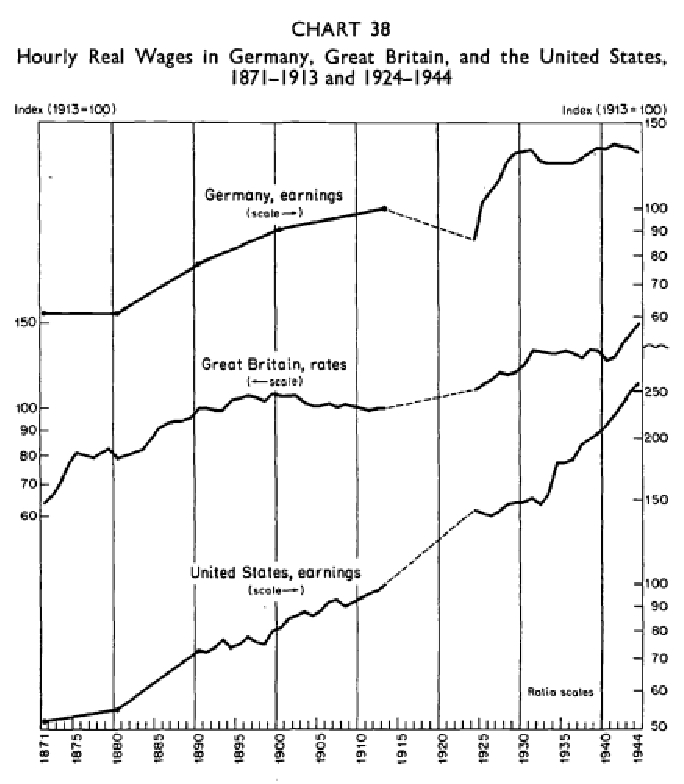
With economic revival in the New Deal era, wages began to tick upward in 1934. Nominal wages climbed back to 1929 levels by 1937 and real wages reached the same mark by 1940. The figures and graphs here show the movement of both nominal wages (in current dollars) and real wages (adjusted for inflation) from the early 1920s to the early 1940s:

New Deal programs and policies helped lift wages beyond what economic recovery in the private sector was able to generate. Recognition of unions and labor rights — starting with the National Industrial Relations Act in 1933 and confirmed by the National Labor Relations Act of 1935 – was crucial to the revival of organized labor during the 1930s and beyond (labor research has consistently shown that unionized workers earn more on average than non-unionized workers). In 1939 the New Deal added the first federal minimum wage floor to lift the earnings of the lowest strata of workers.
Earnings continued to rise in the postwar era, despite the major setback to organized labor in the Taft-Hartley Act of 1946. In recent decades, policymakers have moved away from the New Deal and focused on the interests of shareholders and big donors. Union rates have fallen steadily since the 1970s and minimum wages have lagged badly. As a result, wages for the lower 2/3ds of the labor force have been practically stagnant.
Note: Data for the gross earnings chart comes from U.S. Department of Labor, Employment and Earnings,Vol. 7 No. 2 (August 1960), p. 29 (Table C-1, “Gross hours and earnings of production workers in manufacturing, 1919 to date”). The real wages graph is from Gerhard Bry,“Wages in Germany, Great Britain, and the United States,” p. 278, in Gerhard Bry (ed.), Wages in Germany, 1871-1945, Princeton University Press, 1960. For an introduction to labor organizing in the New Deal era and the pushback by employers in the Neoliberal era, see Nelson Lichtenstein, The State of the Union: A Century of American Labor. Princeton, NJ: Princeton University Press, 2002. On stagnant wages, see “For most U.S. workers, real wages have barely budged in decades,” Pew Research Center, August 7, 2018).
After the Stock Market Crash of 1929, millions of Americans struggled to afford basic necessities, let alone save money. With New Deal reforms, that changed. However, jobless Americans enjoyed a stronger, New Deal-created safety net to soften the hardships of unemployment (for example, food stamps and the distribution of large amounts of surplus commodities).
Here are the personal savings rates (as a percentage of disposable income) for Americans from 1929 to 1941:
1929: +4.7%
1930: +4.5%
1931: +4.4%
1932: -0.2%
1933: -0.7%
1934: +1.7%
1935: +5.1%
1936: +7.1%
1937: +6.7%
1938: +2.9%
1939: +5.4%
1940: +6.8%
1941: +13.9%
Personal savings continued to be strong from 1942 through 1984, when many New Deal policies and programs were still robust, exceeding 10 percent annually 38 out of 43 years. From 1985 to the present, however, the personal savings rate has never exceeded a yearly rate of 10 percent, and has routinely been below 8 percent. This period, often called the era of “Neo-Liberalism,” featured wage stagnation, union decline, and rollback of many New Deal policies. During the 10-year period 1999 to 2008, the personal savings rate never went above an annual rate of 5.8 percent.
Note: Data from the U.S. Bureau of Economic Analysis.
Consumer spending is mostly determined by economic performance, prevailing wages and government transfer payments (such as pensions), with an added element of household outlook. Consumer spending improved sharply during the New Deal thanks to a revived economy, greater employment and rising wages, plus a renewed sense of personal security and optimism. After struggling through years of economic recession, the majority of Americans finally had money in their pockets to buy goods and services.
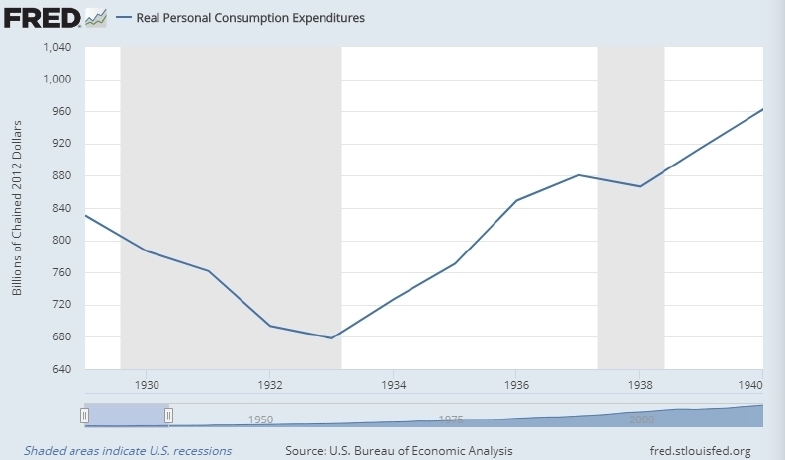
The graph above shows Real, i.e., adjusted-for-inflation, Personal Consumption Expenditures (a measure of consumer spending) from 1929-1940.
The New Deal’s programs helped revive the American economy and put people to work earning wages, while the growth of labor unions and rising productivity kept wages on the rise (as noted in prior entries). Furthermore, social aid programs brought more government transfers to the disadvantaged, while unemployment insurance and social security kicked in later in the decade.
The role of consumer spending in economic growth and recession is still debated by economists, but FDR’s Chairman of the Federal Reserve, Marriner Eccles (a banker from Utah) was convinced that the Great Depression was brought on by a reduction in consumer purchasing power due to growing income and wealth inequality in the 1920s (see our biography of Eccles here). Higher taxes on the wealthy and corporations instituted during the New Deal certainly helped fund social security and other programs, while rising wages further cut into class inequality through the 1950s.
Note: The graph is provided by the Federal Reserve Bank of St. Louis, using data from the U.S.Bureau of Economic Analysis.
Government Finances
New Deal policymakers were able to replenish federal coffers, which had hit their nadir in 1932-33. Federal tax revenues were bolstered by a growing economy and by taxes on alcohol sales (with the end of Prohibition in 1933) and higher taxes on high income households and corporate profits.
Here are federal receipts for fiscal years 1925-1947 (in billions), not including Social Security taxes:
1925: 3.8
1926: 4.0
1927: 4.1
1928: 4.0
1929: 4.0
1930: 4.2
1931: 3.3
1932: 2.1
1933: 2.1
1934: 3.1
1935: 3.8
1936: 4.1
1937: 5.0
1938: 5.9
1939: 5.2
1940: 5.4
1941: 7.6
1942: 12.8
1943: 22.3
1944: 44.1
1945: 46.5
1946: 43.0
1947: 43.3
There is a notable jump in federal revenues beginning with fiscal year 1942, which was brought about by new wartime taxes as well as the national mobilization to fight the Second World War. Some of the new taxes continued after the war in an effort to “balance the budget… finance the European recovery program… [and] provide a substantial surplus for retirement of debt”, which had soared with government borrowing to pay for the war. (Quote from the annual report of the Secretary of the Treasury, fiscal year 1947, p. 1 ).
Along with rising revenues, federal spending ramped up during the New Deal years, becoming a larger part of the U.S. economy. Here are the figures:
1929: 3 %
1930: 3 %
1931: 4 %
1932: 8 %
1933: 8 %
1934: 10%
1935: 9 %
1936: 10%
1937: 9 %
1938: 8 %
1939: 10 %
Note: Revenue statistics are from the U.S. Treasury’s annual reports, fiscal years 1925-1946, most of which are available at Hathitrust. Federal spending as a percentage of GDP from Gilder-Lehrman Institute of American history website at: https://www.gilderlehrman.org/content/statistics-impact-depression
In the 19th century, state and local governments were hesitant to undertake major spending programs after the canal building boom of the 1820s-30s ended with several states in bankruptcy in the 1840s. The railroad booms of the 1950-60s and 1880s were privately financed and similarly came to grief in the downturns of the 1870s and 1890s. Most local investments were financed on a piecemeal basis through special property assessments.
The Progressive Era (1890-1910) ramped up public spending dramatically, especially by cities, but was restrained by the short financial crisis of 1908 and the onset of World War One. State and local spending took off again after the war, with debt loads rising rapidly. By the end of the boom of the 1920s, many cities and states were overextended and were effectively (sometimes formally) bankrupt after the Great Depression hit.
The New Deal’s Emergency Relief Act of 1933 was a godsend for public finances, providing some $3 billion in grants to state and local governments and bringing most of them back to solvency. Economic revival and the growth of state and local revenues did the rest. Debt crises only began to reappear in the 1970s and beyond, with the 21st century looking more and more risky. The following chart shows the rise and fall of state and local debt.
Local and State Debt Levels in the 20th Century as Percentage of National GDP (local in red, state in blue)

At the start of the 20th century, local government debt stood at about 8 percent of US GDP; by the end of the 1920s, it had reached 13.5 percent. When the Great Depress hit it jumped to 28 percent of GDP in 1933 before declining sharply during the New Deal years. At the start of the 20th century, state government debt stood at only 1 percent of GDP; it expanded briskly through the 1920s to 2.2 percent of GDP in 1929, then shot up to 5.31 percent in 1933 before falling again with New Deal aid.
World War II, which put a halt to most non-military government projects, brought local debt down to 5.5 percent in 1948 and state debt all the way back to 1 percent in 1946.
Note: on 19th century local finances, see Robin Einhorn, Property Rules: Political Economy in Chicago, 1833-1872. Chicago: University of Chicago Press, 1991. On the Progressive Era, see Jon Teaford, The Unheralded Triumph: City Government in America, 1870-1900. Baltimore: Johns Hopkins University Press, 1984. On the postwar era, see Alberta Sbragia, Debt Wish: Entrepreneurial Cities, U.S. Federalism and Economic Development. Pittsburgh: University of Pittsburgh Press, 1996. 20th century debt chart at USgovernmentspending,com.
Environment
Public Works & Infrastructure
Human Welfare
The U.S. suicide rate reached a record high of 17.4 per 100,000 citizens in 1932, at the depth of the Great Depression. The graph below shows suicide rates largely decreasing after 1932. Social scientist David Stuckler and epidemiologist Sanjay Basu credit New Deal spending for that downward trend (“How Austerity Kills,” New York Times, May 12, 2013).

Suicide rates remained relatively low from 1941 until just a few years ago, and stabilizing New Deal programs like FDIC, Glass-Steagall, Social Security, unemployment insurance, and union protections probably played a role (see, e.g., “Social Security: Suicide Prevention Tool,” Pacific Standard, March 17, 2017). Recently, as New Deal programs have been threatened or cut back, and Americans have become less economically secure, suicide rates have increased, for example, 14.5 per 100,000 in 2017, the highest rate in three-quarters of a century. Other deaths of despair, such as drug overdoses and liver disease, have also increased.
Note: Information and data can be found in various U.S. government vital statistics reports, for example, Federal Security Agency, U.S. Public Health Service, “Vital Statistics Rates in the United States, 1900-1940,”Washington, DC: U.S. Government Printing Office, 1947; and Centers for Disease Control and Prevention, “Fatal Injury Reports, National, Regional and State, 1981-2017” (accessed March 6, 2019).
Movements in the incidence of crime are notoriously hard to pin down to any one cause and murder is one of the hardest crimes to explain in any single case. Nevertheless, the decline in homicides during the New Deal is clearly etched in the statistics.
The homicide rate was high during the 1920s and rose even higher after the Stock Market Crash of 1929, peaking at 9.7 per 100,000 people at the bottom of the Great Depression. No doubt, mass unemployment, poverty and despair had an impact on the peak in murder and other crimes.
The homicide rate dropped steadily during the New Deal era to 6.0 homicides per 100,000 people in 1941 and continued to decline until the end of World War II.
Here are the homicide rates (firearm homicide rates in parenthesis) in the United States, per 100,000 people, from 1921 to 1946:
1921: 8.1 (5.9)
1922: 8.0 (5.9)
1923: 7.8 (5.6)
1924: 8.1 (5.8)
1925: 8.3 (5.8)
1926: 8.4 (5.8)
1927: 8.4 (5.6)
1928: 8.6 (5.9)
1929: 8.4 (5.5)
1930: 8.8 (6.0)
1931: 9.2 (6.2)
1932: 9.0 (6.1)
1933: 9.7 (6.3)
1934: 9.5 (6.1)
1935: 8.3 (5.1)
1936: 8.0 (4.7)
1937: 7.6 (4.4)
1938: 6.8 (3.9)
1939: 6.4 (3.7)
1940: 6.2 (3.5)
1941: 6.0 (3.4)
1942: 5.8 (3.1)
1943: 5.0 (2.6)
1944: 4.9 (2.6)
1945: 5.6 (3.0)
1946: 6.3 (3.5)
Two initiatives of the Roosevelt Administration almost surely contributed to lower homicide rates: the repeal of prohibition (December 5, 1933) and the National Firearms Act of 1934 (regulating certain dangerous firearms). But two other social factors were probably more important. One was better economic conditions, with rising employment, wages and decline in poverty – and the social stresses that go with those. The other was a heightened sense of solidarity in the nation, as many Americans worked together on rebuilding a shattered country in the Civilian Conservation Corps, Works Progress Administration and, later, national defense efforts. Prison regimes in several states were reformed during the 1930s to be less severe.
Violent crime rates across the United States started up again in the 1960s and peaked in the early 1990s, leading to a draconian crack-down under Nixon’s War on Crime, Reagan’s Zero-Tolerance policy, state laws like California’s Three Strikes, and Clinton’s Violent Crime & Law Enforcement Act. The consequence was to fill up America’s jails and prisons with hundreds of thousands of adults and adolescents, often on minor drug charges. In recent years there has been a growing reaction against that era of hyper-criminalization, which disproportionately targeted young men of color.
Note: Statistics come from the U.S. Department of Health, Education, and Welfare, “Vital Statistics Rates in the United States, 1940-1960,” Washington, DC: U.S. Government Printing Office, 1968, Table 65, pp. 576-594 (the table includes statistics from before 1940).